How diverse are City Cast’s podcast guests?

When we launched City Cast in 2021, we committed to tracking and publishing demographic information about our podcast guests. Diversity is a core City Cast value, and we aim to invite guests on our podcasts who are diverse in age, race and ethnicity, gender, economic background, and geography.
So are we living up to our values? How diverse is our guest pool, really?
We ask each of our podcast guests about their gender identity, racial/ethnic identity, and neighborhood. About 80 percent of guests answer some or all of the questions. We have a year of decent data from City Cast Chicago (July 2021-July 2022), and six months of decent data from City Cast Denver, City Cast Houston, and City Cast Salt Lake (Jan. 2022-July 2022).
Here are the results, and below them a few notes on where we can improve.
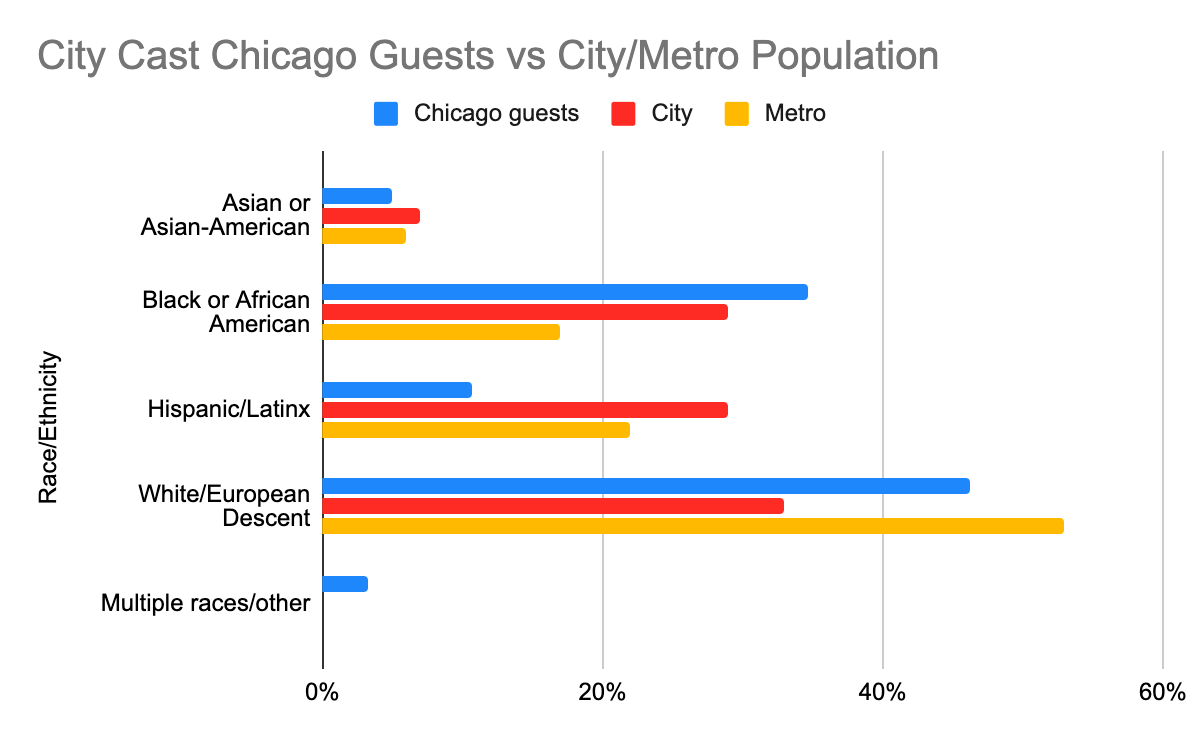
Chicago
We have a year of Chicago guest survey data, including 205 guests who made a total of 248 appearances from July 19, 2021 to July 18, 2022. Around 60 percent of guests chose to answer questions.
- About 46 percent of our Chicago guests identified as white, about 35 percent as Black, about 10 percent as Hispanic/Latinx, and about 5 percent as Asian or Asian American.
- According to the Census, 33 percent of Chicago city residents are non-Hispanic whites, 29 percent are Blacks, 29 percent are Hispanic, and 7 percent are Asian.
- Among Chicago metro area residents, 53 percent are white, 17 percent are Black, 22 percent are Hispanic, and 6 percent are Asian. (Look at the chart below to get a better visual sense of how our guests compare to the city/metro population.)
- About 56 percent of our guests identified as female. About 39 percent identified as male. About 5 percent identified as non-binary.
- We asked guests about their neighborhoods, and 91 answered. They represented 49 different neighborhoods and towns.
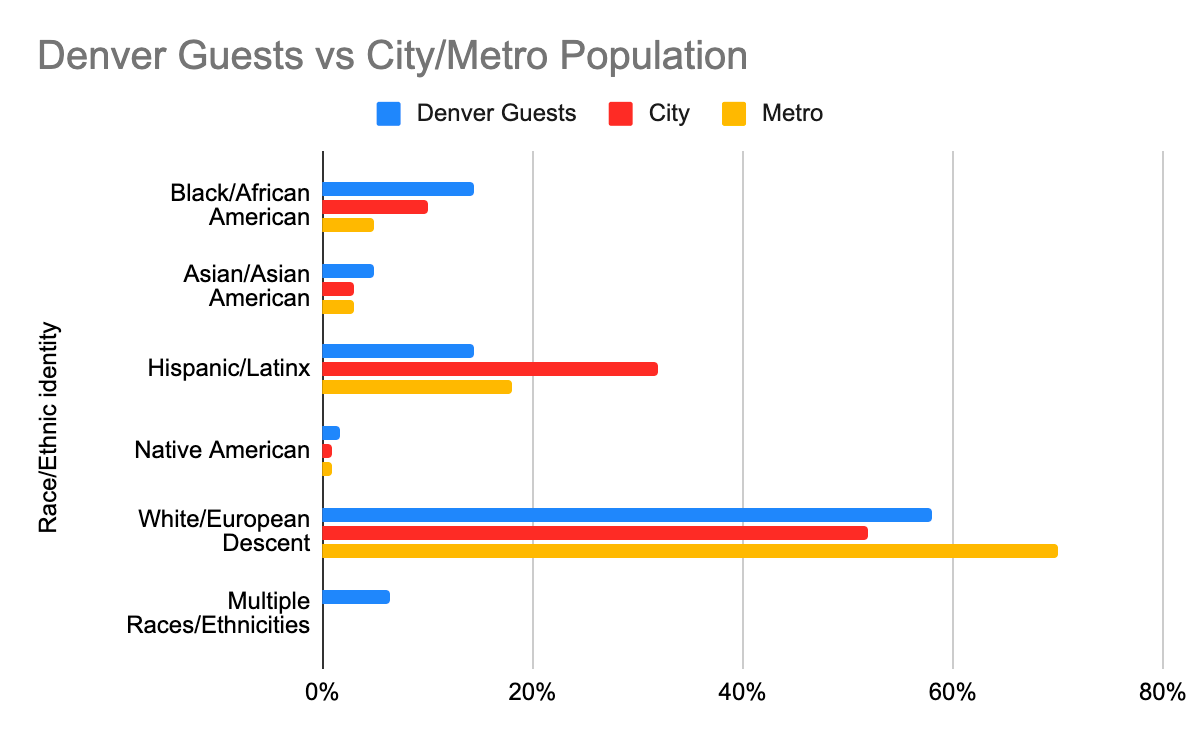
Denver
Denver has data on 72 guests encompassing 74 appearances from Jan. 1, 2022-July 1, 2022. Almost 90 percent of the guests answered at least one of the questions.
- About 58 percent of our Denver guests identified as white, about 15 percent as Black, about 15 percent as Hispanic/Latinx, about 5 percent as Asian or Asian American, and about 2 percent as Native. About 7 percent identified themselves as having more than one race.
- According to the Census, 52 percent of Denver city residents are non-Hispanic White, 10 percent are Black, 32 percent are Hispanic, 3 percent are Asian, and 1 percent are Native.
- Metro Denver is 70 percent white, 5 percent Black, 18 percent Hispanic, 3 percent Asian, and 1 percent Native.
- About 48 percent of our guests identified as female. About 44 percent identified as male. About 8 percent identified as non-binary.
- Our Denver guests represented 38 different neighborhoods and towns.
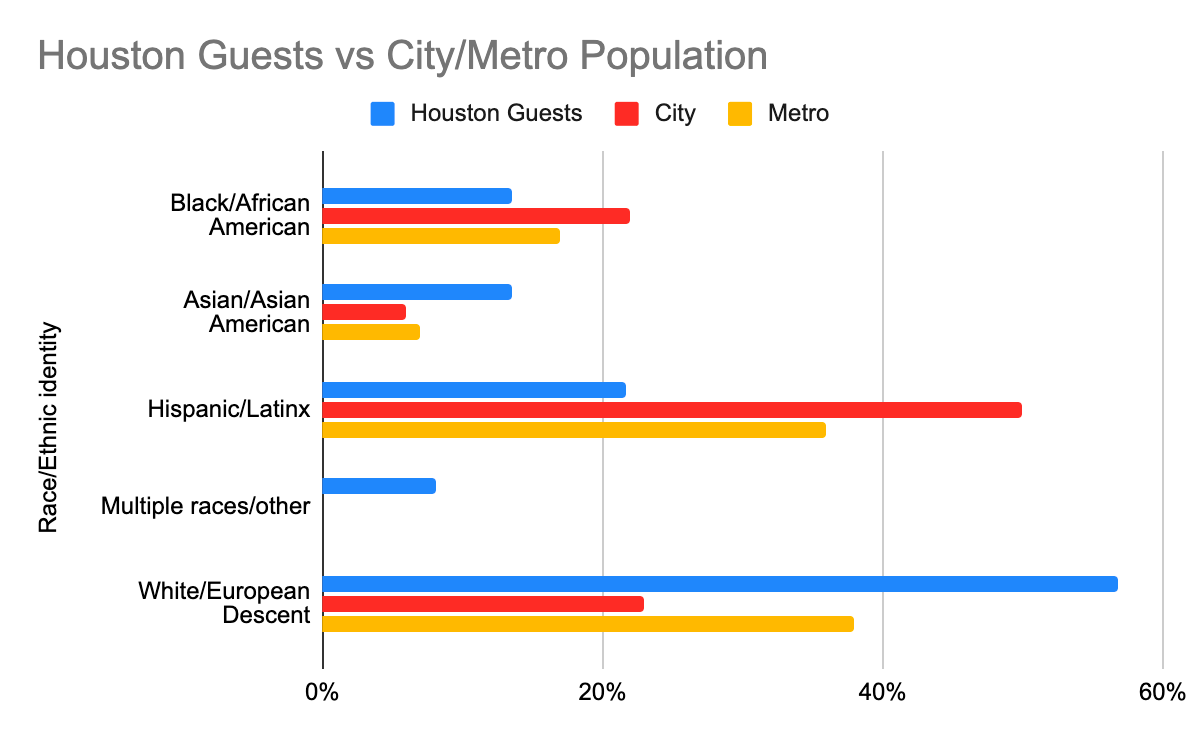
Houston
Houston has data on 42 guests encompassing 48 appearances from Jan. 1, 2022-July 1, 2022. More than 90 percent of the guests answered at least one of the questions.
- About 50 percent of our Houston guests identified as white, about 12 percent as Black, about 19 percent as Hispanic/Latinx, about 12 percent as Asian or Asian American, and about 5 percent as Middle Eastern.
- According to the Census, 23 percent of Houston city residents are non-Hispanic white, 22 percent are Black, 50 percent are Hispanic, and 6 percent are Asian.
- Houston metro is 38 percent white, 17 percent Black, 36 percent Hispanic, and 7 percent Asian.
- About 46 percent of our Houston guests identified as female. About 51 percent identified as male. About 3 percent identified as non-binary.
- Our Houston guests represented 17 different neighborhoods and towns.
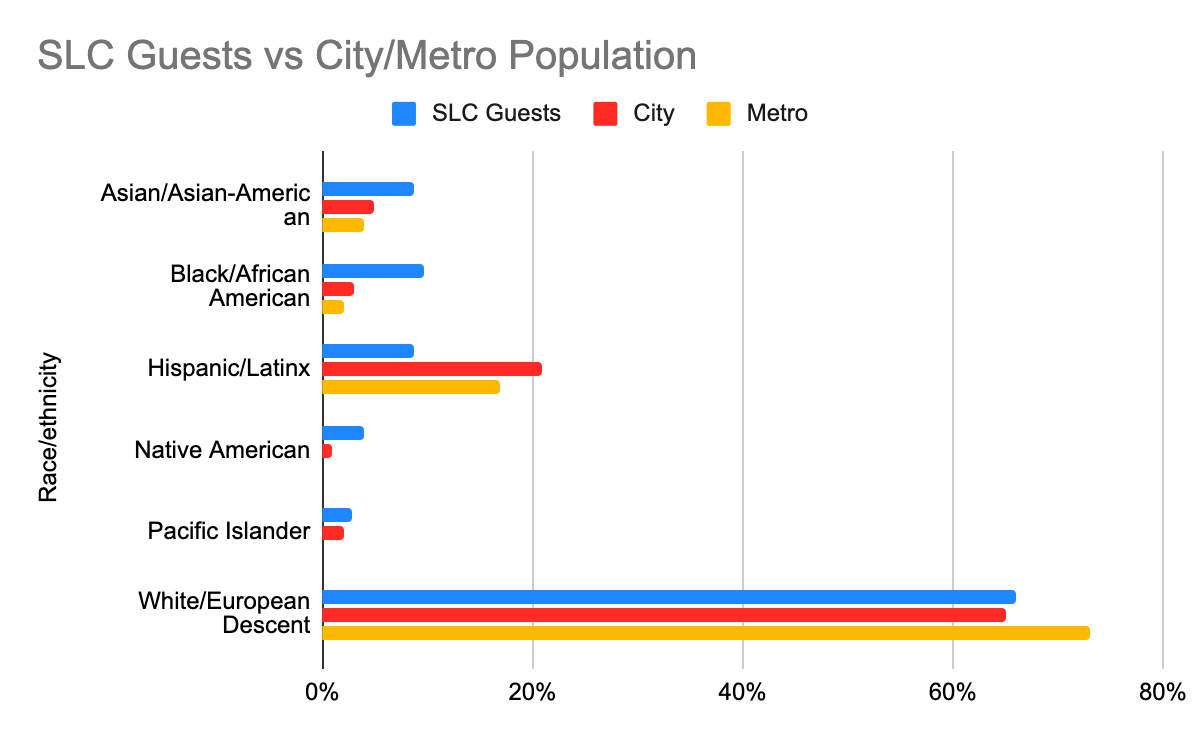
Salt Lake City
Salt Lake has data on 105 guests encompassing 141 appearances from Jan. 1, 2022-July 1, 2022. About 80 percent of the guests answered questions.
- About 66 percent of our Salt Lake guests identified as white, about 10 percent as Black, about 9 percent as Hispanic/Latinx, about 9 percent as Asian or Asian American, about 4 percent as Native, and about 3 percent as Pacific Islanders.
- According to the Census, 65 percent of Salt Lake City residents are non-Hispanic White, 3 percent are Black, 21 percent are Hispanic, 5 percent are Asian, 1 percent is Native, and 2 percent is Pacific Islander.
- Metro Salt Lake is 73 percent white, 2 percent Black, 17 percent Hispanic, 4 percent Asian, and 4 percent mixed or other.
- About 48 percent of our Salt Lake guests identified as female. About 48 percent identified as male. About 2 percent identified as non-binary.
- Our Salt Lake guests represented 27 different neighborhoods and towns.
Conclusion
City Cast is doing a pretty good job representing the racial and ethnic diversity, gender diversity, and geographic diversity of our cities. We’re featuring a broad variety of guests in each city, and–with one significant exception–that variety closely matches the actual diversity of the city and the metro area.
The exception is our under-representation of Hispanic/Latinx guests. In every city, the percentage of Hispanic/Latinx guests is less than the percentage of Hispanic/Latinx residents of the city and metro area. There are understandable reasons for this shortfall: Many Hispanics and Latinx people are immigrants, and immigrant communities are traditionally hard for journalists to access. Some are probably non-English speakers. Podcast penetration is likely lower among Hispanic/Latinx residents of our cities than among other groups, which makes them less likely to know City Cast and be part of the community we’re building. But it’s clear that we need to push to get more excellent Hispanic/Latinx guests on City Casts everywhere.